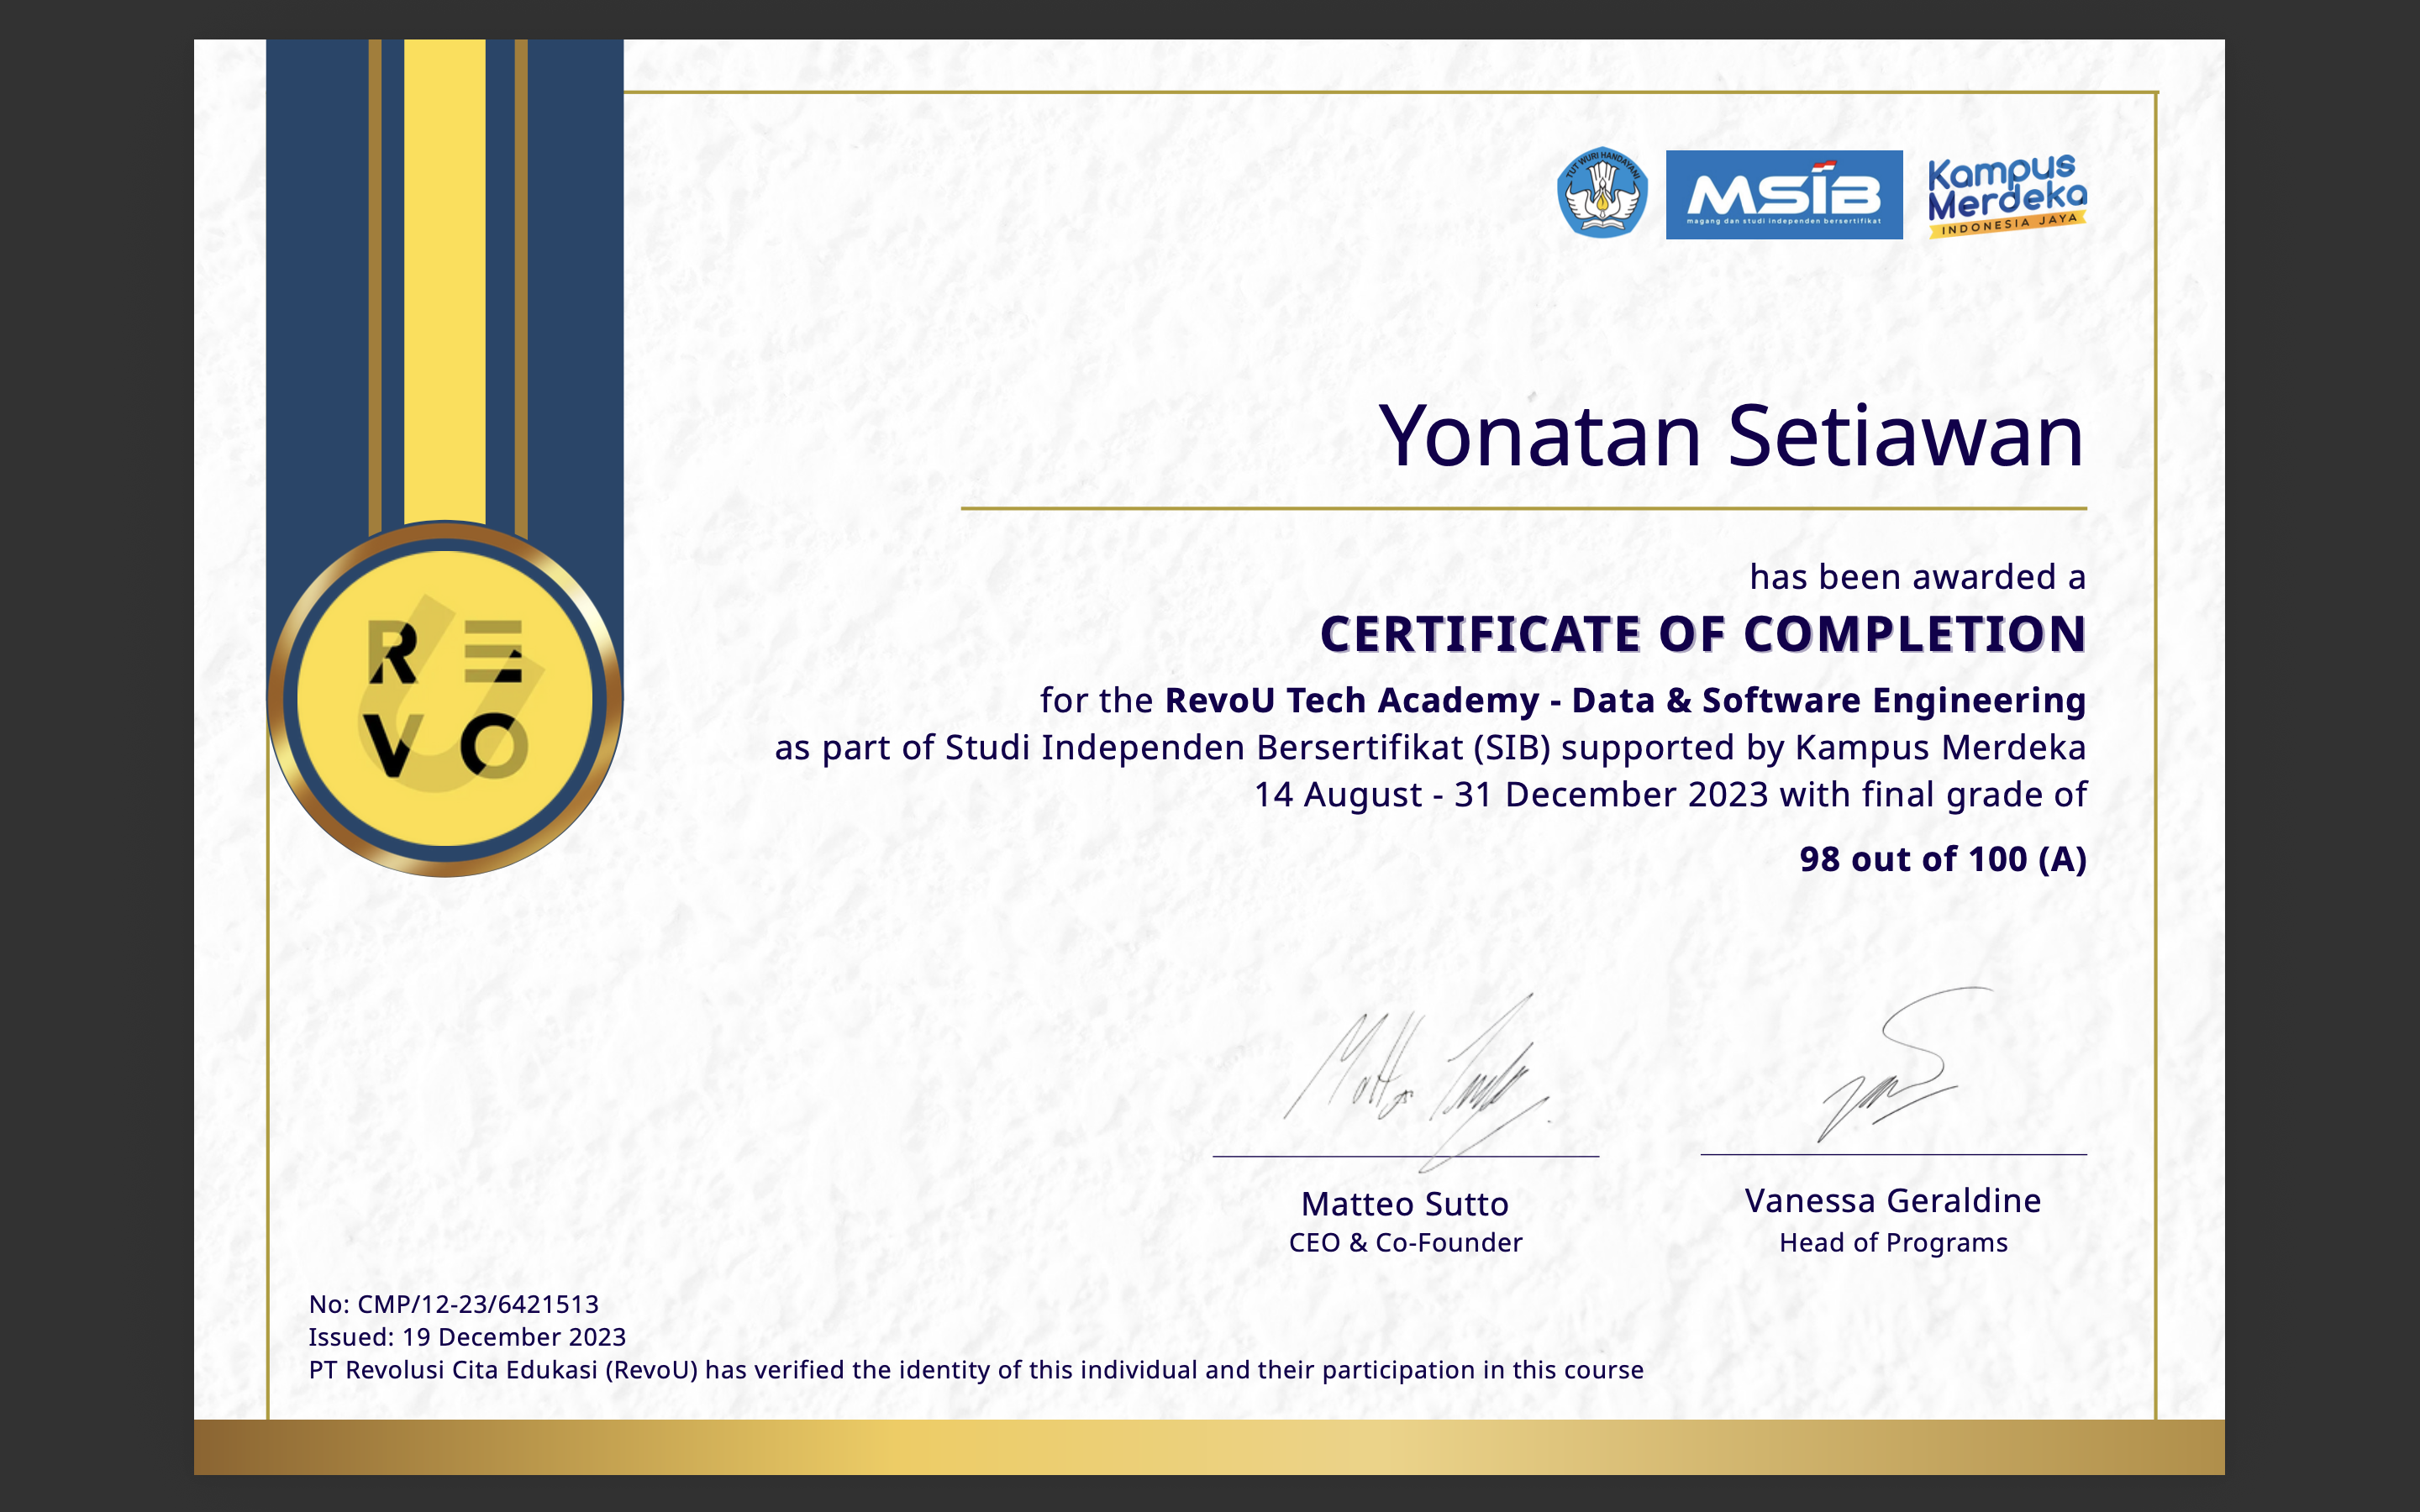
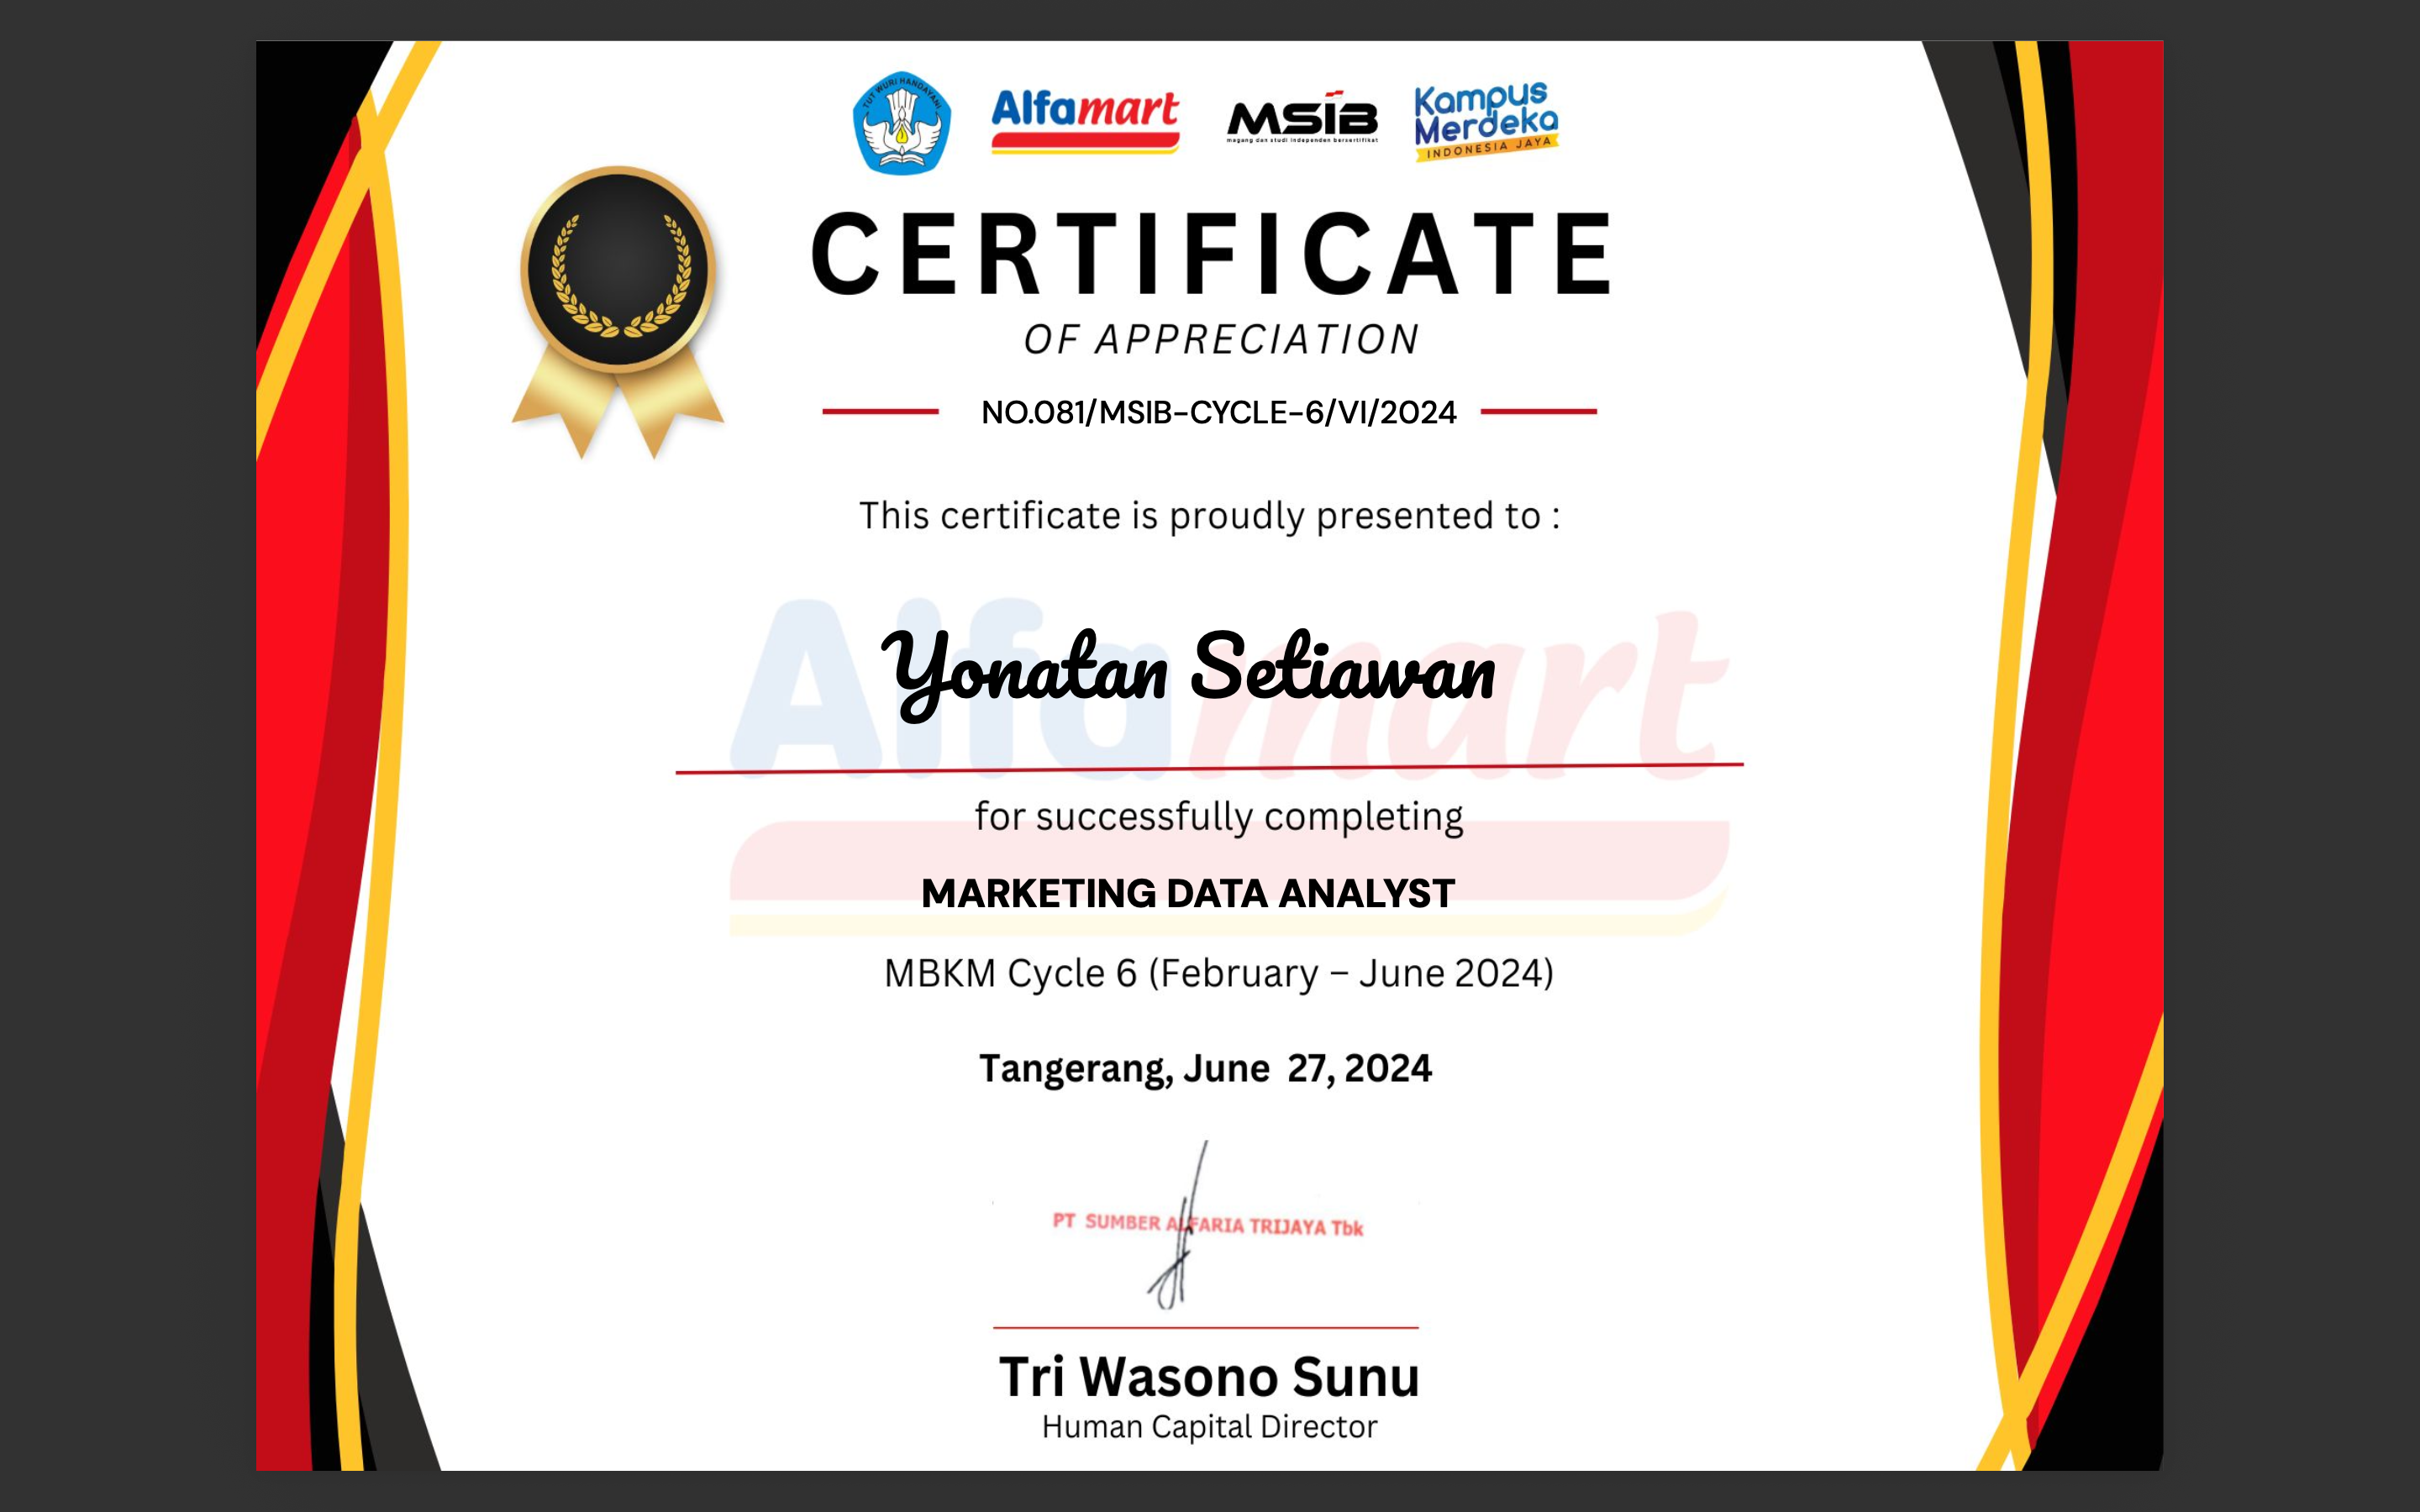
I am a Data Enthuasist with experience in processing and analyzing data using Python, Excel, SQL, Google Data Studio, Power BI, and Tableau. I can create interactive dashboards for data visualization and perform statistical analysis to support business decision-making.
Contact Me
I’m a passionate Data Analyst and fresh graduate in Information Systems from the University of Jember (GPA 3.85/4.00). I specialize in data analysis, visualization, and statistical modeling, with hands-on experience in projects and internships involving sales and marketing data. I’ve worked as a Marketing Data Analyst at Alfamart, developing dashboards and generating insights that improved campaign performance. I’m also skilled in Python, SQL, and Google Data Studio, with strong teamwork, leadership, and problem-solving abilities.
Sales Member dashboard showing key performance indicators (KPIs) and various charts analyzing quantity (QTY, NET, Struk) by highest/lowest totals, categories, time, regions, and members.
A sales contribution dashboard showing key performance indicators (KPIs) and various charts analyzing sales, structures, and contributions by members, stores, and regions.
New Member dashboard displaying key performance indicators (KPIs) and various charts analyzing new member numbers, sales, basket size, and structures.
A sales dashboard displaying key performance indicators (KPIs) and various charts analyzing profit, transactions, neighborhoods, and building categories.